
Almost no otolaryngologist ever listens to the voice in a systematic way. But hoarseness — like hearing impairment — is sound wave impairment, and patterns of impairment are identifiable. A simple graph of pitch versus volume is the laryngologist’s map.
Visualizing the Invisible Sound
Surprisingly, almost no otolaryngologist ever listens to the voice in a systematic way. Even laryngologists rarely assess vocal capabilities in a systematic way. Imagine otology without audiograms. Audiograms reveal patterns that the otologist can recognize and point the astute examiner to the appropriate anatomy or physiology which is likely causing the impairment. Hoarseness, like hearing impairment, is also sound wave impairment — and patterns of impairment are identifiable.
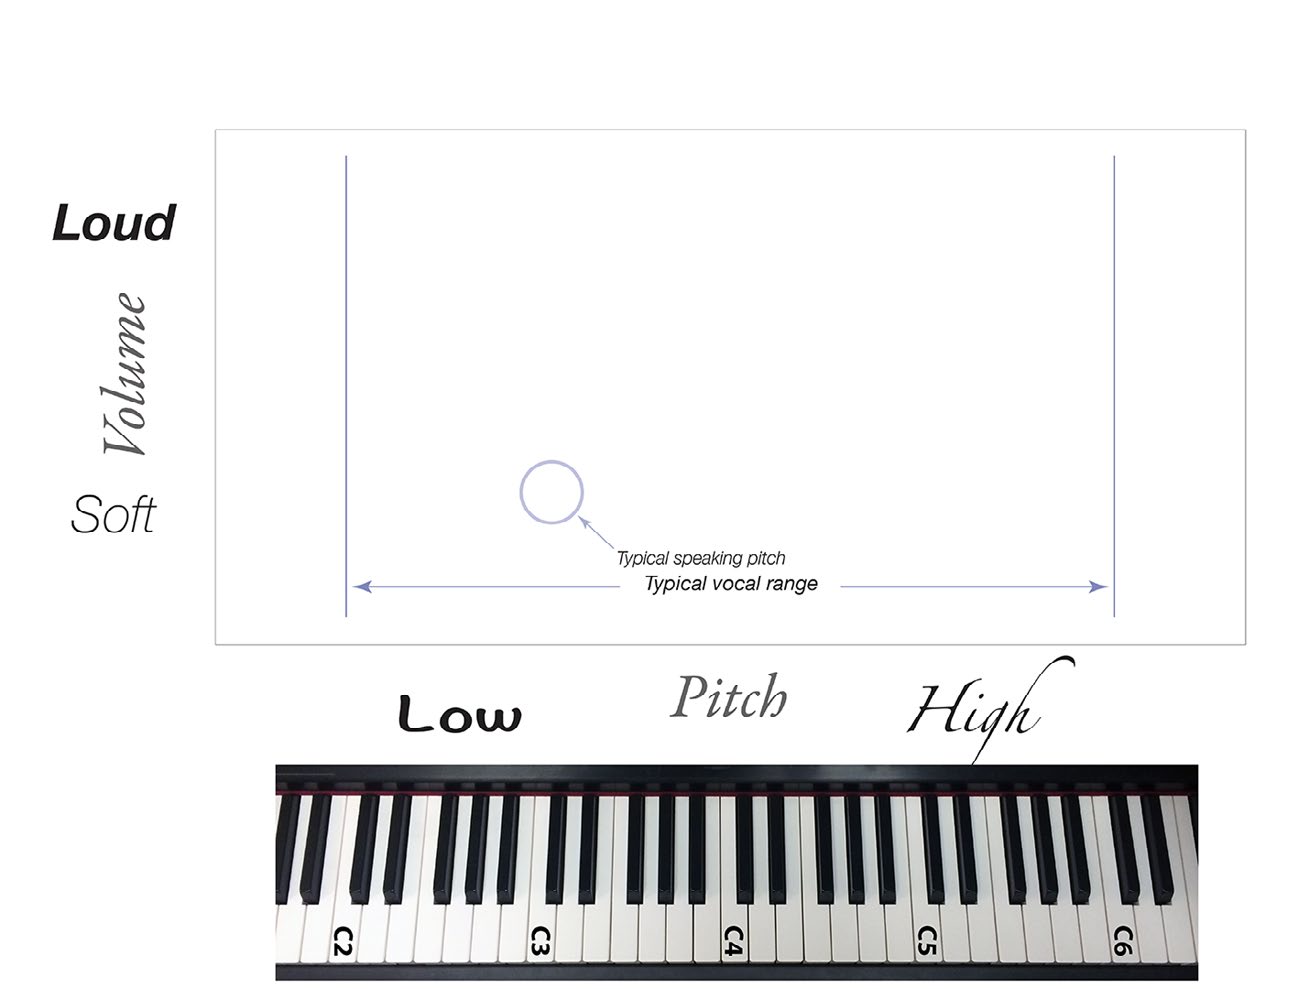
With sound, we have pitch, volume and clarity to be concerned with on our vocal exam, so it will be helpful to visualize their interaction. Let’s set up a graph correlating pitch with volume.
While this graph can be created quite precisely — in the form of a phonetogram — in my daily practice I am interested in using this graph in a clinical fashion, not as a precise measurement, but as a general guide to focus my visual examination where problems should be located. I am searching for a pattern of impairment. A given pattern on this graph will then direct my visual endoscopic exam.
Reading the Graph
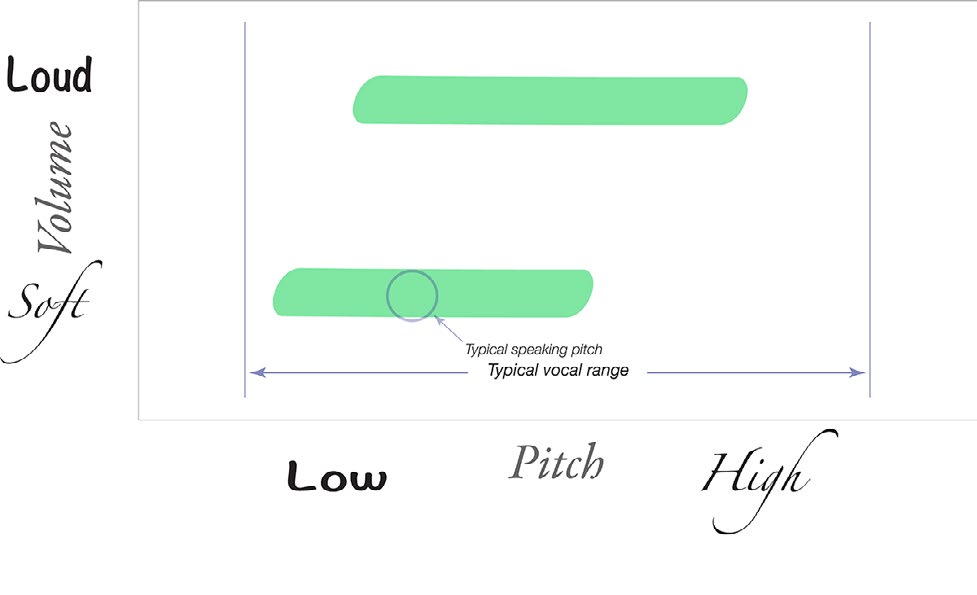
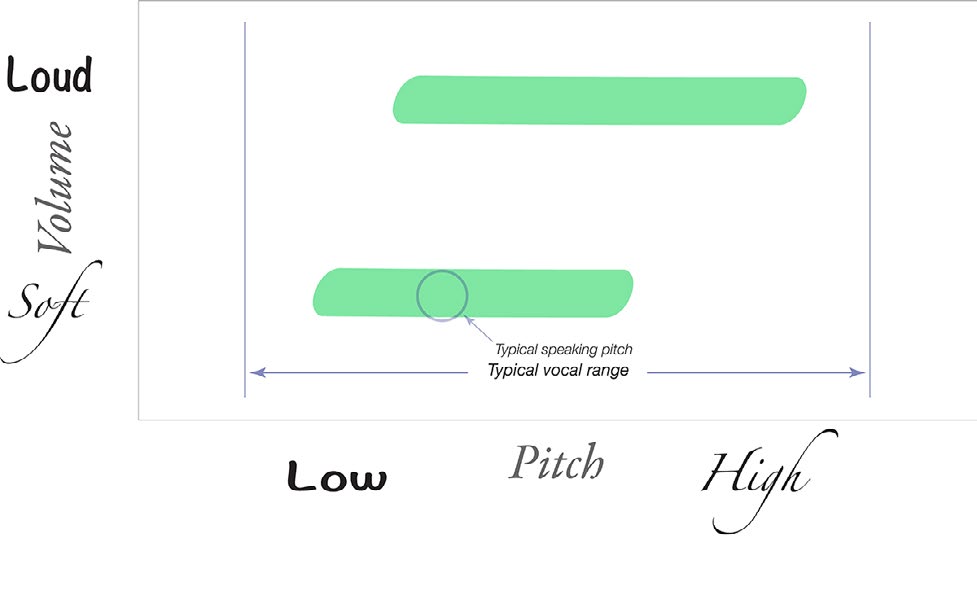
Pitch is graphed along the x-axis and correlates roughly with a keyboard. If a vocally healthy male were examined throughout his vocal range at soft volume and then again at a louder volume, we could diagram his voice, noting where his comfortable speaking pitch was located and his vocal range. A typical female’s voice would be shifted to the right in comparison to a male. A smaller person with a smaller larynx will also have a vocal pattern shifted to the right. The painted areas represent the clear sounds she could make throughout her soft and loud vocal ranges. A trained vocalist of either sex would typically have longer areas of coloration — a larger audible toolbox.
This graph represents the audible toolbox for the laryngologist. We could call it a laryngogram or clinical phonetogram.
If I know that an individual leaks air at low pitch, low volume and there is no perceptible leak at high pitch, high volume, I can already start a differential diagnosis — before we have even discussed the patient’s history.
Roughness and Breathiness as Pattern Finders
In 1981, Hirano postulated that roughness and breathiness could be utilized to identify a voice disorder. His working group suggested the GRBAS scale, where severities of five characteristics were rated (Grade, Roughness, Breathiness, Asthenia, Strain). Despite its frequency of use in scientific literature, the scale has not led to patterns that identify the type of vocal impairment. However, roughness and breathiness — equivalent to huskiness in this book — I believe are key parameters that can point to a pattern that identifies the problem. These two parameters need more than a number estimating their intensity. They need to be correlated with pitch and volume to be meaningful.
If a patient is scored as a 2 on the breathiness scale and another is scored as a 4, those numbers give no clue about what the difference in their voice problem might be. Barely a differential diagnosis could be started. But if I know that an individual leaks air at low pitch and low volume and there is no perceptible leak at high pitch and high volume, I can already begin a differential diagnosis. Presbyphonia, muscle atrophy, and paresis of the anterior branch of the recurrent laryngeal nerve would be strong potential matches given just this singular piece of information. Tumors, neurologic tremor, spasms, and superior laryngeal nerve injuries would all be unlikely candidates. We haven’t even discussed the patient’s history yet — and we already have a good idea where we are headed.
A Prediction
It seems highly likely that someday a patient with hoarseness could record a vocal glide from their lowest to highest pitch at soft volume and again at a loud volume, and a computer with sufficient processing power and previous data could use artificial intelligence to match the patterns of areas of clarity, roughness and breathiness up with historical controls and make a fairly accurate prediction as to what endoscopy will show. Until that time, I find it helpful to have a battery of tests on the voice that I can use to elicit vocal impairments in the patient complaining of hoarseness.
What You Learned
- Pitch vs. volume is the laryngologist’s map — charting where the voice is clear, husky, or rough reveals a pattern that predicts what endoscopy will find.
- Severity scores alone are insufficient — knowing that breathiness is “a 2” or “a 4” is nearly meaningless without knowing at which pitch and volume it occurs.
- Air leak at low pitch and volume suggests atrophy, bowing, or paresis — a single finding on the pitch-volume graph already begins to rule in and rule out diagnoses.
- Pattern recognition is the goal — the laryngogram functions like an audiogram: the pattern of impairment points to the anatomy or physiology causing it.